


Excel Book on Marketing Analysis and Reporting
Stop poring through Excel book after Excel book that promise to tell you all the features/functions available in Excel, without showing you how and in what business situations you can use them!
De-duplication of customer names are now made so much easier. We used to highlight them in different colors and manually identifying them and removing it. It took days. After going thru the case studies, it just took seconds to have it done. Pivot Table and Charting is a dynamic way of summarizing data into useful charts and make things very visible for marketers, especially when they don’t think in grids.
Amie Choy, Strategic Marketing Manager,Robert Bosch Security Technology, Asia Pacific Region

With this excel book, you can quickly and easily master the functions and formulas in Microsoft® Excel guaranteed to generate your Analysis and Reports without staying up late to crunch those numbers manually through the spreadsheets!
Looking for ways to analyse and develop your sales and marketing plan?Just click a few buttons and presto…You have just uncovered your sales potential from the data!
Dear Sales and Marketing Managers,
How much is an accurate sales analysis and report worth to your business?
Suppose you’ve just been given an Excel worksheet containing 10,000 sales records for the past 12 months and your boss wants you to identify the top 10 selling products and the customers buying them for the next year’s sales and marketing plan. He urgently needs to have this information by tomorrow and assumes that you can get this easily done for him. You know very well that your IT department will need a lead time of at least 2 weeks to fulfil the request. It looks like a dire situation and you’re having cold feet about not being able to complete it by tomorrow even if you burn the midnight oil. You desperately need to find a fast way of doing this!
What if I tell you that there is rather untold, yet powerful means of activating an MS Excel function that will enable you to finish this report within seconds without any sweat?
Sounds unbelievable?
Well, sure it does if you know only the existence of Excel functions and have not yet experienced any real business application.
Think about it. Learning how to use Excel for business is one of the most powerful skills you could learn. By combining a few formulas and clicking a few buttons, the report is done for you in seconds. Furthermore, it is even many times more accurate than when you have to manually work on each of the 10,000 customer entries. I cannot be more serious to tell you this — knowing how to exploit MS Excel is a skill that every smart business Excel user absolutely MUST acquire!
But Using Excel to EffectivelyGenerate Accurate and Detailed Sales Analysis And ReportsIs The Hard Part…
It could take you years and cost you a small fortune to discover just the right functions and formulas to use to generate those sales analysis and reports in minutes – while many just fall flat on their face.
Instead of knocking yourself out and spending valuable time to complete sales analysis and reports manually, you can now have access to the secrets in this one-of-its-kind Excel manual called:
“Excel Secrets for Highly Effective Marketers”
At last! Answers to how you can solve your biggest Excel problems in analyzing sales and preparing reports can now be found here!
But don’t just take my word for it, here’s what people who have used what we teach in the manual have to say:
|
“Almost 70% of the things I’ve learnt in this course are totally new to me. For instance, I was unable to extract part of the information from a cell; didn’t know this was possible until I went for this course. It saves me a lot of time by using the formulas, instead of having to cut and paste one by one.” Patricia Pong, Senior Associate |
|
“I am now able to track forecast changes which each country give without having to remind them to mark changes in a different color. Pivot chart is also a great eye opener.” Diana Ng, Demand Planning Manager,Symrise Pte Ltd |
|
“I have learnt the power of using formulas to prepare a detailed price contract in much a shorter time frame by saving about 20% of the time and with much less mistake.” Sharon Long, Manager,NCS Group |
|
“This course has taught me how to use the pivot table effectively, and helped me see the benefits of some functions to help me save time in analyzing and retrieving useful sales data, and on the use of some functions which I did not know of before.” Dawn Lee, Sales Manager,Research Biolabs Pte Ltd |
|
“In my organization, we need to analyze & present data at a regional level. However, our data is only available in separate tables by country. I learn how to merge data from these files & present them at a consolidated level. The pivot charts are also very useful in presenting our KPIs on a regular basis.” Patrina Kuek, Financial Analyst,Acushnet Singapore Pte Ltd |
|
I have always been clueless about the power of Excel, doing many things the manual way like counting amount in cells and doing manual layouts. To me, Excel has always been just another program I layout my reports with. But after attending this Excel course, I realize that there is so much more power stored in Excel to help enhance and make efficient daily work reports that I have to do especially with ensuring accurate details in figures in big amounts. I’m sure as I continue to explore what has been taught, I will be able to save a lot more time and stop pulling my hair out while I face my reports again. Rachael Low, Trade Marketing Executive,Johnson and Johnson Vision Care Singapore |
|
I have learnt many powerful tools in excel. I used to spent a couple of hours compiling and presenting the information from databases for reporting. Now, I am able to extract valuable information from various databases for my reports within minutes. After going through the case studies, I manage to get the report together with charts out within 10 minutes, with the pivot table and chart function. Agnes Tan,Singapore Heart Foundation |
|
I learnt that Excel has many more functions that I’m not aware of. It opens my mind in exploring more and thinking of how I can make use of it to collect data. I’m hoping the knowledge gained here will help me do data query and improve my productivity. I want to cut down the time needed to collate data and present it in good visual presentation too. I think I should be able to do that now. Ivy Low, Administrative Executive,Breastfeeding Mothers’ Support Group |
|
I now have a much better understanding of what can be done using Excel for my business and also know how to do it! As the course has real examples and each case study is a build up, it is easy to understand the context and immediately make reference to my own company and problems I have faced. Neeraj Sundarajoo, Senior Consultant ,Comwerks Interactive |
|
I discover the power of pivot tables and charts which allows me to chart very quickly. I now know what my staff can do to extract data and better design forms for feedback survey after each talk or event. Ho Sun Yee, Chief Eexecutive Officer,Singapore Heart Foundation |
|
In my day-to-day planning function, I have to manage a lot of data, to translate these data into meaning reports for analysis and planning purpose. This course has enabled me to use some useful formulas & functions to get the report I want in a reduced time. Lynn Soon, Demand and Supply Planning Analyst,Acushnet Singapore Pte Ltd |
|
“The Excel Pivot Table combined with MS Query are fantastic tools! I managed to use them to extract the required data from Accpac and submit it to my Organisation’s HQ in Germany. I actually recommend your course to one of my business associates who claims to work a lot with Excel and databases. When I showed him how quickly I could sort out databases for e.g. with VLOOKUP of the Industry Class, he was SOLD! Thanks to your Excel course plus your guidance!” Bilal, Managing Director,Igus Singapore Pte Ltd |
You may still be a bit skeptical and have some reservation, but think about this – if you keep doing the same things over and over again – you’ll only succeed in getting the same old results. So, try out my proven Excel approach.
Which Of These Powerful SecretsCould You Use ToIncrease Your Productivity by 40%?
-
How to find month from dates
-
Remove duplicates in a list
-
Create subtotals automatically for each sales category
-
Retrieve text of varying length intelligently
-
Create chart that always show the most recent results
-
Consolidate data from different workbooks
-
Compare Sales between 2 time periods
-
Looking up prices for quotations plus, lots more
Okay, So What’s the Cost for This Incredible Resource?
Well, we realize that this Excel book can easily sell for thousands of dollars. In fact if you asked a top-notch Excel consultant, like myself, to develop these sales analysis and reports for you, you’d be charged in the neighborhood of $2,000 to $5,000.
I currently charge a minimum of $4,000 for a customized in-house training. So at bare bones minimum you’re getting thousands and thousands of dollars worth of Excel solutions at your disposal.
But I’m not going to charge you anywhere near that amount or even my minimum training fees. In fact, your total investment for this Specialized excel book is only $29.90.
Look at it this way – this amount is really a painless drop in the bucket compared to the quality you are going to get for those sales analysis and reports this year. That’s why…
You Really Can’t Afford Not To Invest In This Excel Secrets for Highly Effective Marketers Manual!
It’s easy to get started right away. Buy a copy of this excel book from Amazon.
Get ready to present those accurate sales reports in at a fraction of your time!

Jason Khoo,FoundereverydayExcel Business Lab Pte Ltd
P.S. Just think! You’ll never again suffer the pain of staying up late to manually analyze and prepare those sales reports.
P.P.S. You will be able to spend more time with your family and at the same time, impress your boss using your new found skills!
If you are looking for an Excel book based on Excel 2007/2010, please click on this Excel book link.

New! Comments
Have your say about what you just read! Leave me a comment in the box below.
Share this page:
Enjoy this page? Please pay it forward. Here’s how…
Would you prefer to share this page with others by linking to it?
- Click on the HTML link code below.
- Copy and paste it, adding a note of your own, into your blog, a Web page, forums, a blog comment, your Facebook account, or anywhere that someone would find this page valuable.
<a href=”http://www.advanced-excel.com/”>Advanced Excel – From a Business Perspective</a><a href=”http://www.advanced-excel.com/”>Advanced Excel – From a Business Perspective</a>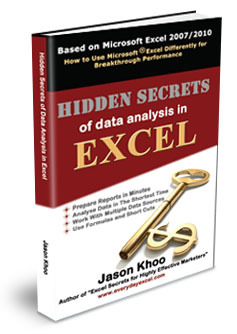

Excel Courses for Business Professionals
Copyright © advanced-excel.com 2007 – 2019. All Rights Reserved. Privacy Policy
Microsoft® and Microsoft Excel® are registered trademarks of Microsoft Corporation.
advanced-excel.com is in no way associated with Microsoft