Data Analytics Value Chain Improves Excel Reporting
The data analytics value chain consists of a series of interconnected steps that organizations follow to derive value from their data. These steps include data collection, data storage, data processing, data analysis, and reporting. These steps can significantly improve the reporting process in Excel by offering a structured approach that focuses on extracting meaningful insights from raw data.
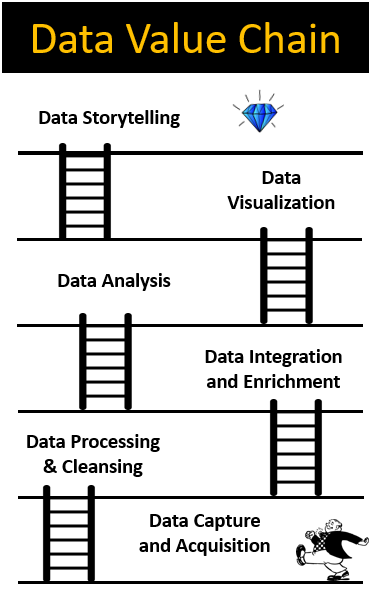
1. Data Capture & Acquisition
The initial step involves gathering raw data from internal and external sources. Decisions made during data collection impact data quality and usability throughout its life cycle. Data capture could be acquiring data from public databases, survey forms, and business processes. Excel facilitates seamless data import from diverse sources, aligning with this phase.
2. Data Processing & Cleansing
Following data collection, the focus shifts to processing, organizing, and cleansing the data. Excel’s functions and Power Query simplify this step, aiding in identifying and correcting corrupt, inaccurate, or irrelevant data. Excel functions like Concatenate, TEXT, Text to Columns, Search, MID and other worksheets functions help to process the data efficiently. Power Query helps to capture and automate the steps in this stage
3. Data Curation, Integration & Enrichment
This step encompasses merging data from various sources (Excel, CSV, SQL servers, Sharepoint) into a cohesive dataset and enhancing it with contextual metadata. Excel’s Power Query supports efficient data integration and transformation, aligning with this phase. VLOOKUP, VSTACK and XLOOKUP are used to integrate data manually
4. Data Analysis
Now equipped with cleansed and labeled data, Excel’s analytical functions and tools empower users to analyze datasets, revealing trends, patterns, and insights that contribute to informed decision-making. In Excel, we can make use of Pivot Table and SUB-TOTAL.
5. Data Visualization and Data Storytelling
In the concluding phase, emphasis is on data visualization and storytelling. Excel’s rich visualization features and tools support the creation of compelling data visualizations and stories, aiding in effective communication of insights and findings.
By aligning Excel’s capabilities with each step of the data analytics value chain, users can seamlessly progress from data capture to data visualization and storytelling, ensuring a comprehensive and efficient data analytics process. Excel’s integration with these steps enhances the overall quality and effectiveness of the data analytics journey.