Pivot Table
What is Pivot Table
Pivot Table is a function in Microsoft Excel. It helps to group your records into categories and provide a subtotal for each category.
Using Pivot Table, you can quickly find out the sum, count, average, max, and min for each category. There is no need to do multiple auto-filter again if you need to find the sub-total for each category.
In fact, Pivot Table allows you to group your data into sub-categories and display the total for these sub-categories too. In fact, you can do it for many sub-categories.
Examples of Pivot Table Reports
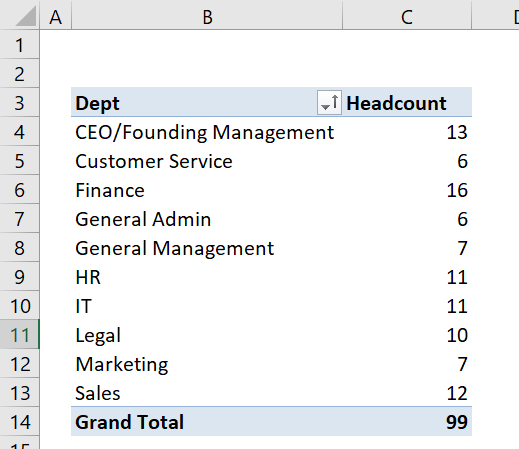
Headcount report showing how many staff are in each department
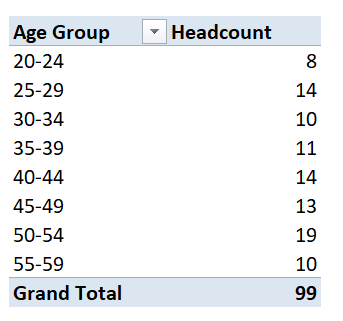
Headcount report showing the age profile of the staff
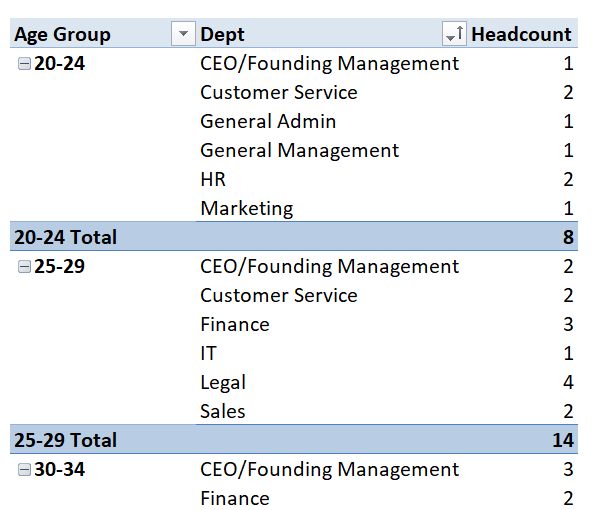
Headcount report showing the age profile of the staff and the department the staff are working in.